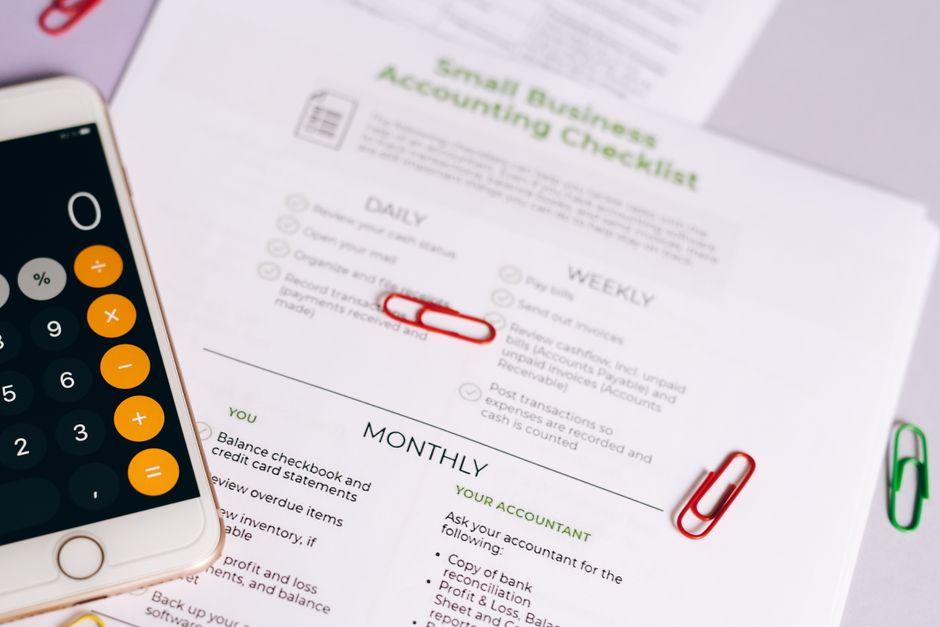
Account management is a scheduling problem before it is a relationship problem. A small company with 200 customers has to decide who gets a visit this month, who gets a call, and who gets nothing, and most of those decisions land on whoever was loudest last week. The constraint underneath all of it is that a rep can physically see about 12 accounts in a week. Which 12 is the entire question, and a customer list sorted by revenue has no way to answer it.
Limits of a Revenue Sorted List
Account reviews usually start from a report sorted by revenue. That report answers which customers are largest and how much each spent last year. It cannot answer which customers are near each other, because the address is a text string and proximity is not something a person computes by reading.
The gap matters most for the middle of the base. The top 10 accounts get attention because everyone knows their names. The bottom of the list gets ignored on purpose. The middle 150 are where growth actually sits, and they are invisible in a report that sorts by size and silent in a conversation that never gets to row 40.
Plotting the Account Base
The first useful view costs nothing but an export. Customer records go into free mapping software with address, revenue, and last contact date attached, and what comes back is a map where dot position is location, dot size is revenue, and dot color is recency. 3 variables, one screen, and no reading.
The patterns that surface are consistent across industries. There is usually a cluster of medium accounts within 30 minutes of the office that has not been visited in a year, because nobody was scheduling by geography. There is usually a large account 2 hours away that gets attention because it is large, and 4 medium accounts along the same highway that get none.
Visits Are a Travel Budget
Once the map exists, the review question changes from which accounts matter most to which accounts can be reached in a day. A rep with 200 accounts and 4 selling days a week cannot see everyone. What the map produces is a set of realistic loops: 5 or 6 accounts in one direction that together fill a day and justify the drive.
Access to customers has measurable value. Economists studying Japanese firms found that a new high-speed passenger rail line, which cut travel time for people while leaving shipping costs untouched, improved firm performance and produced new buyer-seller links, a result reported in a National Bureau of Economic Research working paper on geography and firm performance. Cheaper access to partners changed which partners firms ended up with.
A small business cannot build a rail line. It can stop scheduling visits in an order that ignores the road network, which is that mechanism at a scale one company controls.
3 Variables on One Screen
The map works because a person can compare position, size, and color in a single glance, while 12 columns of numbers have to be read in sequence and held in memory. Guidance on the Excel chart types most people actually need approaches it from the other direction: a pie chart falls apart past 5 or 6 slices, and a line chart turns into a tangle past 3 or 4 series.
A 200 account business has 200 slices. There is no standard chart that takes a customer list and returns a route, and that is why the account review keeps defaulting to the revenue sort.
The Case for Calendaring the Existing Base
Chasing new logos is more visible than serving old ones, and the balance drifts accordingly. The cost side argues against the drift. A construction consulting executive writing in trade press noted that typical general contractor win rates on competitive bids run near 25%, so roughly 75% of estimating cost returns nothing, and laid out when a firm should switch from bidding to negotiated work won through established relationships.
Every industry has its own version of that ratio. Work from a customer who already buys costs less to win, closes faster, and gets priced on trust rather than on the lowest number. The account base is the cheapest pipeline in the building, and it is the one nobody puts on a calendar.
Segmenting by What Each Account Needs
Not every account should get the same cadence, and the map makes segmentation concrete. Split the base 3 ways. High revenue accounts get a scheduled quarterly visit placed on the calendar 3 months out. Medium accounts get bundled into the loops that pass their door anyway. Small and distant accounts get a phone and email cadence with no windshield time at all.
Large organizations run a formal version of this. Trade coverage of B2B practice reported that 92% of marketers surveyed described account-based marketing as extremely or very important to their overall effort, which is the enterprise vocabulary for naming the accounts that matter and building the calendar around them. A 3 person company does it with a map and a highlighter.
Watching for Accounts Going Quiet
Recency coloring is the part owners keep using. Green for contact in the last 60 days, yellow for 60 to 180, red beyond that, refreshed monthly. A red dot inside a dense green cluster is the most actionable object on the map, because it marks a customer the company can reach easily and has stopped reaching.
The coloring also catches the slow version of churn, where nobody cancels anything and the orders simply stop. In a revenue report that pattern is 2 quarters old before it is legible. On the map it appears the month the color changes.
Territory Handover After a Departure
When a rep leaves, the account map becomes the handover document. It shows the replacement which accounts sit close together, which have been ignored, and which are large enough to see in the first week. A spreadsheet handover contains the same facts in an order nobody can act on, and the first month gets spent rediscovering the geography.
Back to the 12 Accounts
A rep who can see 12 accounts a week will see 12 accounts a week no matter how the list is sorted. What the map changes is which 12, and how much of the day goes to driving between them. Across a quarter that is roughly 150 visits, and the gap between a planned set of 150 and an accidental one is the whole return on an afternoon’s work with an export file.